


What's The Problem?
Using D3 in a react project can cause problems. Both React and D3 want to have control of your DOM so we need to separate who controls what. If we allow two libraries to control the same part of the DOM, we will have some issues!
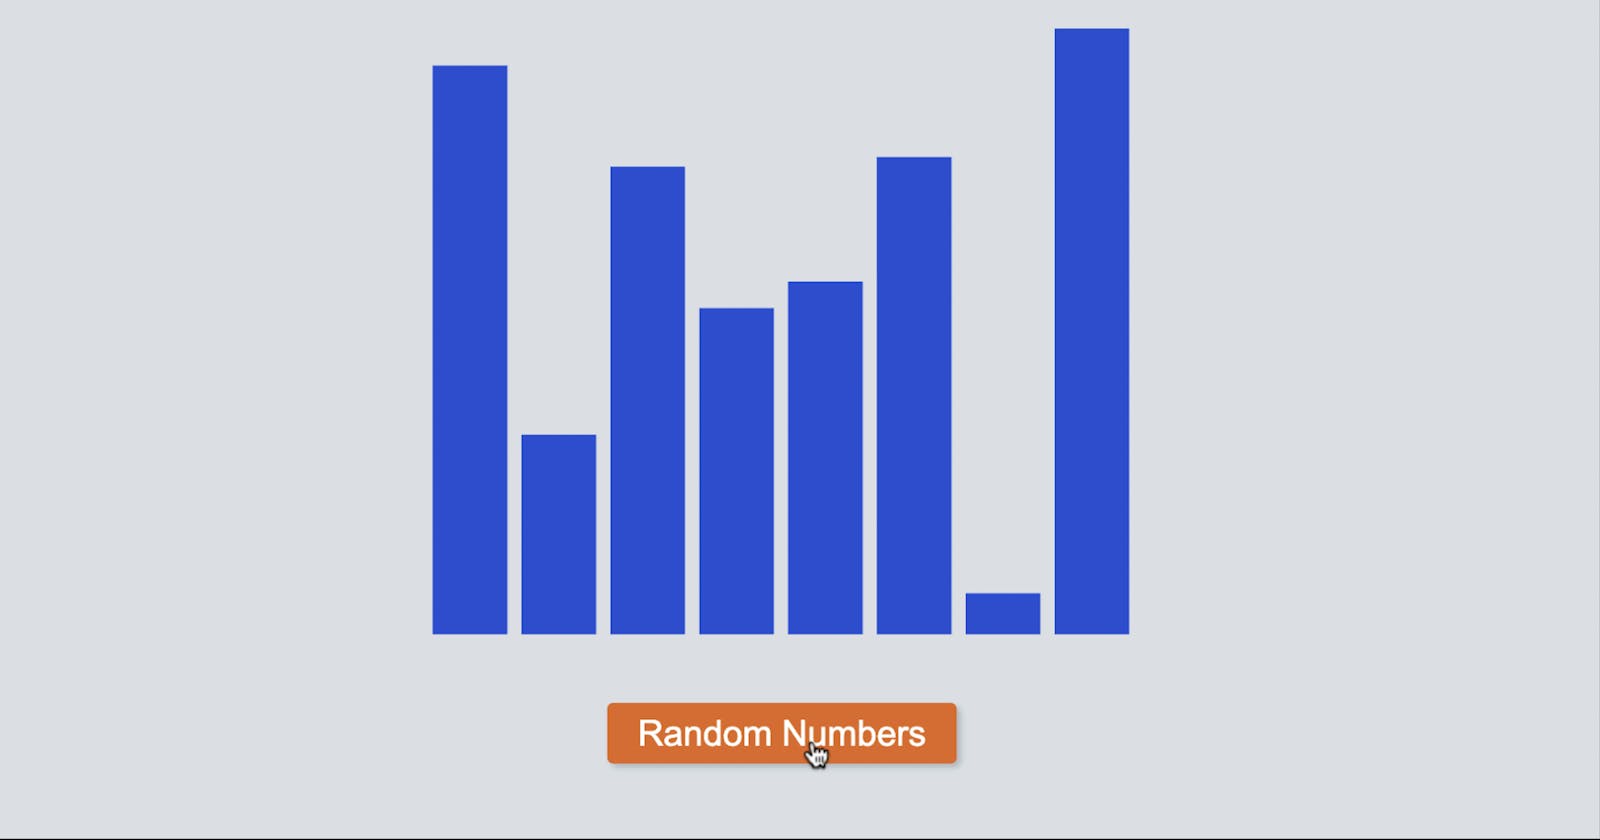
Let's make a React component with a button to update the bar chart data. You can see the final code here
Separating Control
The bar chart data will be held in React state. But the chart will be rendered with D3.
Realistically for something as simple as a bar chart (especially like this one with no axis or a key) we could create the whole chart in React. We could map the data to create a series of rectangles
const data = [5,25,15]
<svg>
  {data.map(value => <rect height={value}>)}
</svg>
This way we could use any animation library we want. In fact, we wouldn't even need to use SVG. But let's assume our data visualization is going to get much more complex and we are going to need D3
There are some npm packages we can use that take care of this problem. But React and D3 are both always developing and so these packages will need to be well maintained and you'll need to make updates when they are. So let's just separate it ourselves.
Separating Who Has Control of The Which DOM Element
Save the SVG ref
Firstly let's only give React access to the main SVG element and never control anything inside it with React and let's store that object in React using useRef
import { useRef } from "react";

export default function App() {

  const svgRef = useRef();

  return (
    <div>
      <svg ref={svgRef} />
    </div>
  );
}
Store Our State Data
The svgRef variable will be the only interaction React has with the SVG.
However, our chart will want to be able to access react state too. So let's create a state for our chart data that updates by clicking a button
import { useRef, useState } from "react";

// function to create an array of 8 random numbers up to the height
const randomData = (n) =>
  new Array(n).fill(1).map(() => Math.random());

export default function App() {

  // react state to store our numbers
  const [data, setData] = useState(randomData(8));
  const svgRef = useRef();

  return (
    <div>
      <svg ref={svgRef} />
      {/* A button to create 8 new random numbers */}
      <button
        onClick={() => setData(randomData(8))}>
        Random Numbers
      </button>
    </div>
  );
}
Add A Side Effect
Now, this is all the React we'll need. We just need to run a side effect so we can update our D3 chart when the data is updated.
import { useRef, useState, useEffect } from "react";
...
export default function App() {
  ...

  useEffect(()=>{

   // our D3 code will go here
   // and will rerun everytime 'data' is updated

  }, [data]);

  return (
    <div>
      ...
    </div>
  );
}
this is the one newline.co/@KumailP/wonders-of-react-d3--ho..
Creating The Chart
Install The D3 Package
First of all, let's add d3 to our project. Just run this in the console:npm i d3 s
Select The SVG Element
We have the SVG element saved in a ref. Let's select that and store it to a variable inside our useEffect
import { useRef, useState } from "react";
// import d3.select
import { select } from "d3";
...
export default function App() {
  ...
  const svgRef = useRef();

  useEffect(()=>{

    const svg = select(svgRef.current);

  }, [data]);

  return (
    <div>
      ...
    </div>
  );
}
Control The SVG Elemnt With D3
Now we have the SVG element stored in a variable, let's make a simple adjustment. We'll give it a height and a width
import { useRef, useState } from "react";
import { select } from "d3";

// add a new variables to separate the 'magic number' of 300 and 350
const height = 300;
const width = 350;

export default function App() {
  ...
  useEffect(()=>{

    const svg = select(svgRef.current);

    // chain together two attribute updates
    // to set the width and the height
    svg
      .attr("width", width)
      .attr("height", height);

  }, [data]);
  ...
}
notice we can chain together methods in D3 and sometimes they'll need to be chained
Select The Bars
We need to select the bars in our bar graph. The first time it loads there won't be any rectangles to select, but don't worry about that for now. We'll add them on the first load shortly.
...
export default function App() {
  ...
  useEffect(() => {

    const svg = select(svgRef.current);
    svg
      .attr("width", width)
      .attr("height", height);

    const bars = svg.selectAll("rect").data(data);

  }, [data]);
  ...
}
We store the bar elements in the bars variable, this is because we will handle them differently on the first load than we will when the data changes.
Adding The Bars On First Load
Rather than creating two useEffect and having to split our D3 code up, it might be best to create a flag so we know when the chart is loading for the first time. We'll need to create another useRef tho to store the flag:
...
export default function App() {
  const didMount = useRef(false);
  ...
  useEffect(() => {

    const svg = select(svgRef.current);
    const bars = svg.selectAll("rect").data(data);

    if(!didMount.current) {
      svg
        .attr("width", width)
        .attr("height", height);

      // initial render of the bar chart

      // update the flag after first loaded
      didMount.current = true;
    } else {
      // animate when data changes
    }
  }, [data]);
  ...
}
as we only need to set the width and height of the SVG once on our first load, we can also move this code inside the new conditional block.
Now let's create the bars on the first load
  ...
  useEffect(() => {
    ...
    if(!didMount.current) {
      ...
      bars
        .enter()
        .append("rect")
        .attr("fill", "#225de4");
      ...
    }
  }, [data]);
  ...
You can read more about the enter keyword here written by D3s creator Mike Bostock. Or you can simply think of enter like you're stepping into the data of the bar. similar to .map() we can run enter as many times as we want d3 will only add as many rectangles as we need for the data, we have 8 numbers so it will never add a 9th rectangle. We also added a fill attribute here, this will simply colour the rectangle. But it currently has no width, height or x, y values.
Adding X and width positions for our bars
Let's work out the x and width positions first. Because these are linear. by which I mean, the width of the bars will always be equal. and the x position will always be the width times its position in the array, so the third number in the array will have an x position of 2xwidth. However, there is also a gap between the bars...
 Luckily D3 has a method to make this really easy to calculate, it's called
 scaleBand
scaleBand is what will do the magic to get the uniform x and width values to fit in the SVG with some padding. We pass in an array of incrementing numbers [0,1,2,3...] as the domain and then the range we want it to convert into, in this case, the range of numbers between zero and SVG width. And finally, we can give it a little space between each using paddingInner.
Then when we set the attributes on the bars we can use these numbers to set the x and width attributes.
...
import { select, scaleBand, range } from "d3";

export default function App() {
  ...
  const xScale = scaleBand()
      .domain(data.map((_,i) => i))
      .rangeRound([0, width])
      .paddingInner(0.15);
  ...
  useEffect(() => {
    ...
    if(!didMount.current) {
      ...
      bars
        .enter()
        .append("rect")
        .attr("x", (_, i) => xScale(i))
        .attr("width", xScale.bandwidth())
        .attr("fill", "#225de4");
      ...
    }
  }, [data]);
  ...
}
Notice that we pass .domain(data.map((_,i) => i)) into domain, the map will basically convert to .domain([0,1,2,3,4,5,6,7]) but this way if we do change the number of points in our data we don't have to change this code.
Also note the line .attr("x", (_, i) => xScale(i)) this is passing in the index so we can get the next x position for each bar.
We still aren't seeing anything on the screen, because we need to give our bars some hight still!
Adding in the Height and Y position of each bar
For this, we'll use a slightly different D3 method called scaleLinear it works very similar. We pass in a domain, but this time just the largest and smallest number. And a range we want our numbers to map too. the random numbers we created with Math.random are between 0 and 1 but ideally, we want the bars to fill the height of the SVG so we make the top of the domain the largest number and convert our numbers so the largest number will now be the height of the SVG. To find the largest number in our data we can use d3 max.
For both height and y we pass in d the random number from the array. However note that for the y value we minus the bar height from the svg height. this is because y will obviously be calculated form the top of the svg. So y and height should be equal to the height of the svg.

Let's put this new code outside the conditional so it runs the first time but then updates every time the data updates. Also, let's define a transition and a duration so we get a smooth animation.
And we get a block of code that looks like this:
...
import { select, scaleBand, range, max } from "d3";

export default function App() {
  ...
  const yScale = scaleLinear()
      .domain([0, max(data)])
      .range([0, height]);
  ...
  useEffect(() => {
    ...
    if(!didMount.current) {
      ...
    }

    bars
      .transition()
      .duration(300)
      .attr("y", (d) => height - yScale(d))
      .attr("height", (d) => yScale(d));

  }, [data]);
  ...
}
And we should be about done. But it animates down from the top when we first load the component. Let's just fix that.
Animate Up
when we first render the bars before any transitions take place and before we calculate the height, let's just make the y position of each bar equal to the hight of the svg and make the height of each bar 0. This way the initial animation will be from the bottom instead. And this is our final code
import { useEffect, useRef, useState } from "react";
import { select, scaleBand, scaleLinear, max } from "d3";

const height = 300;
const width = 350;

const randomData = (n) =>
  new Array(n).fill(1).map(() => Math.random());

export default function App() {
  const [data, setData] = useState(randomData(8));

  const didMount = useRef(false);
  const svgRef = useRef();

  useEffect(() => {
    const xScale = scaleBand()
      .domain(data.map((_,i) => i))
      .rangeRound([0, width])
      .paddingInner(0.15);

    const yScale = scaleLinear()
      .domain([0, max(data)])
      .range([0, height]);

    const svg = select(svgRef.current);

    const bars = svg.selectAll("rect").data(data);

    if(!didMount.current) {
      svg.attr("width", width).attr("height", height);
      bars
        .enter()
        .append("rect")
        .attr("x", (_, i) => xScale(i))
        .attr("height", 0)
        .attr("y", height)
        .attr("width", xScale.bandwidth())
        .attr("fill", "#225de4");
      didMount.current = true;
    }

    bars
      .transition()
      .duration(300)
      .attr("y", (d) => height - yScale(d))
      .attr("height", (d) => yScale(d));

  }, [data]);

  return (
    <div className="container">
      <svg ref={svgRef} />
      <button onClick={() => setData(randomData(8))}>Random Numbers</button>
    </div>
  );
}
And again, You can see the final code here
Summary
So we've created a simple bar chart using d3 select to select the svg and work with it. We've used scaleBand and scaleLinear to convert them to numbers that fill the space of the SVG. But most importantly, we've separated our D3 code from our React code so we can keep state in React while leaving D3 to calculate the values and add the transitions to the SVG. Separating out control of different dom elements.