


Why Not Just Use Chrome Dev Tools?
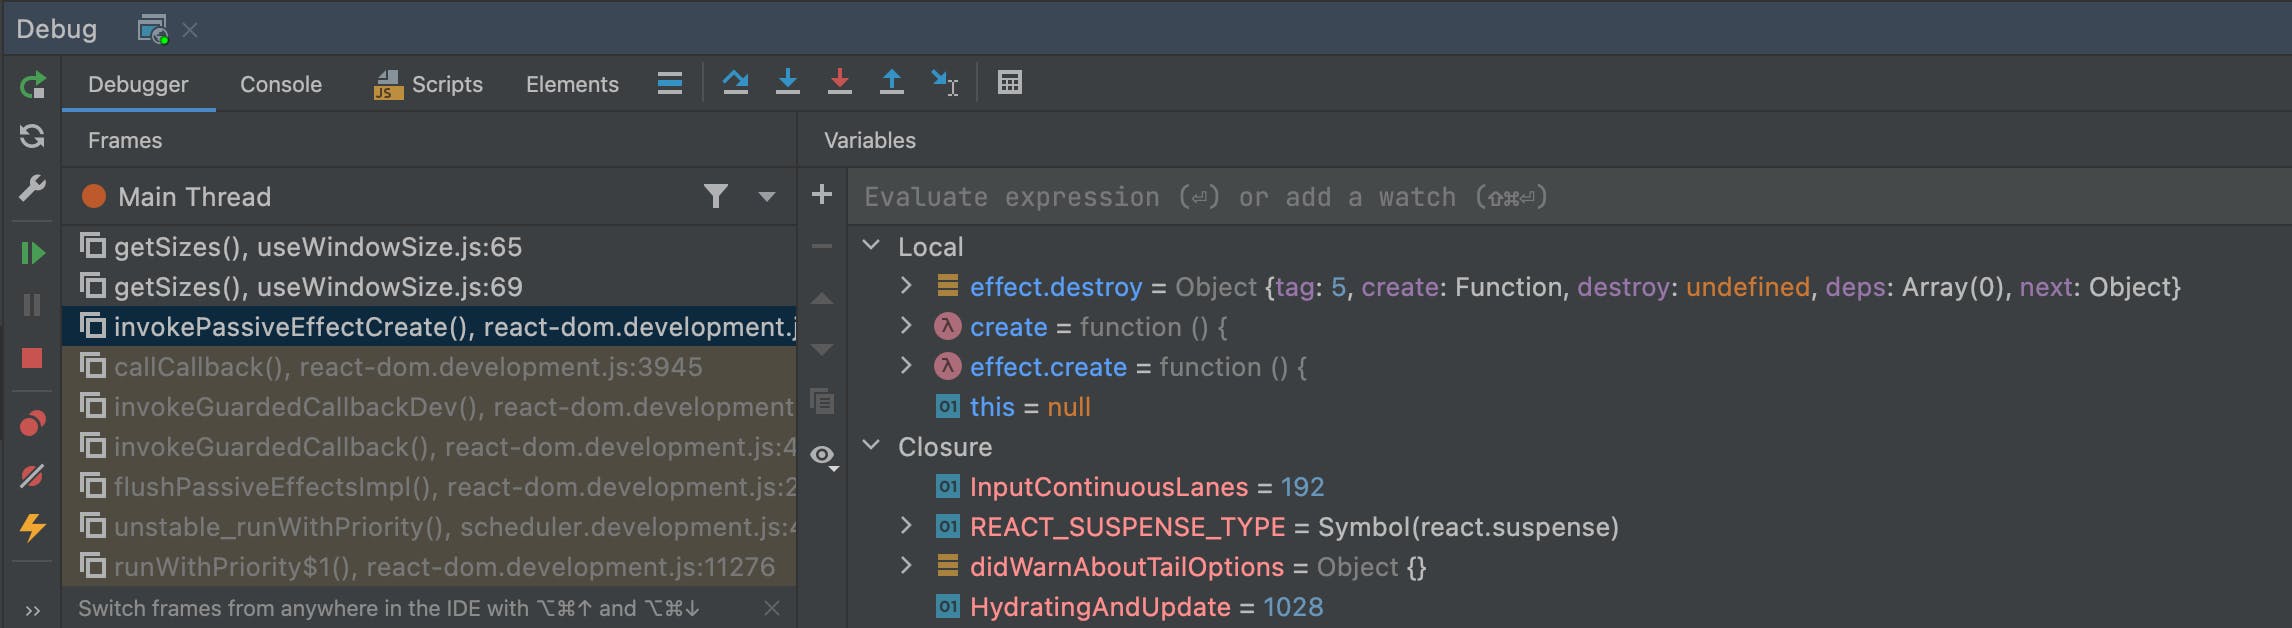
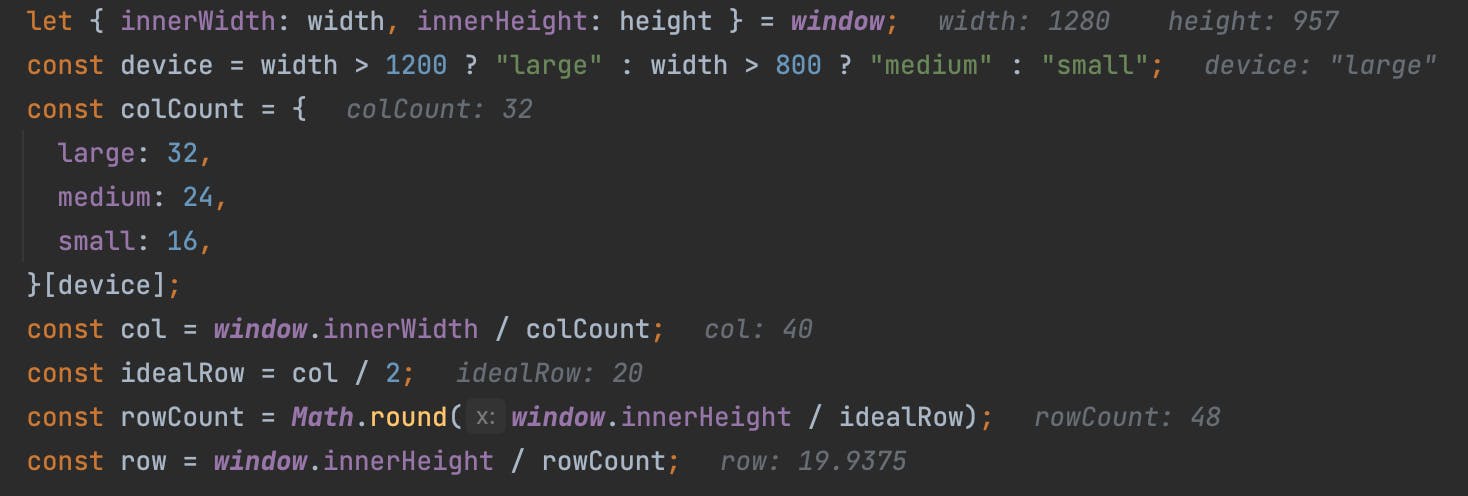
The Chrome Developer Tools are great. Amazing even. But there are some advantages to debugging directly in your IDE, like being able to see the value of each variable exactly in the code you're editing.
Or getting an indicator of which breakpoints have already run. As well as of course being able to keep the breakpoints and not have to put them back in every time you reload your browser.
Debugging In Webstorm
The Webstorm docs have some really details stuff about how to set up debugging for your project. You can set it up to automatically open a browser when you run your dev script and then connect that browser tab to your debug session.
But there is one simple trick to get started without having to set anything up:
1. Start running your code in dev e.g. with npm run dev
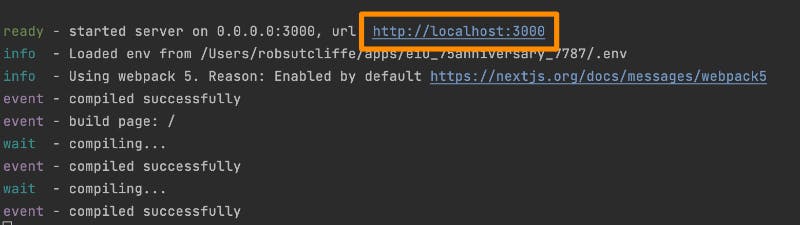
and when your code is running and you have a URL. Rather than just opening a browser tab with that URL or clicking on it...
hold Ctrl+Shift / ⌘⇧ and click on the link.
So with PC, you'd hold Ctrl+Shift and click the link
And on mac, you'd hold ⌘+⇧ and click the link
This will open your application in a new browser window in your favourite browser. But also connect it to your Webstorm debug console. You can now stop at breakpoints, and see your variable values/callstack at that exact point.